Projects
click a link below to learn more about my past projects
This project was originally started as a final project for my graduate planning methodology class. However, since the conclusion of the class
I turned the report into a blog post which has gained traction among resilience professionals.
Below is the Project Abstract:
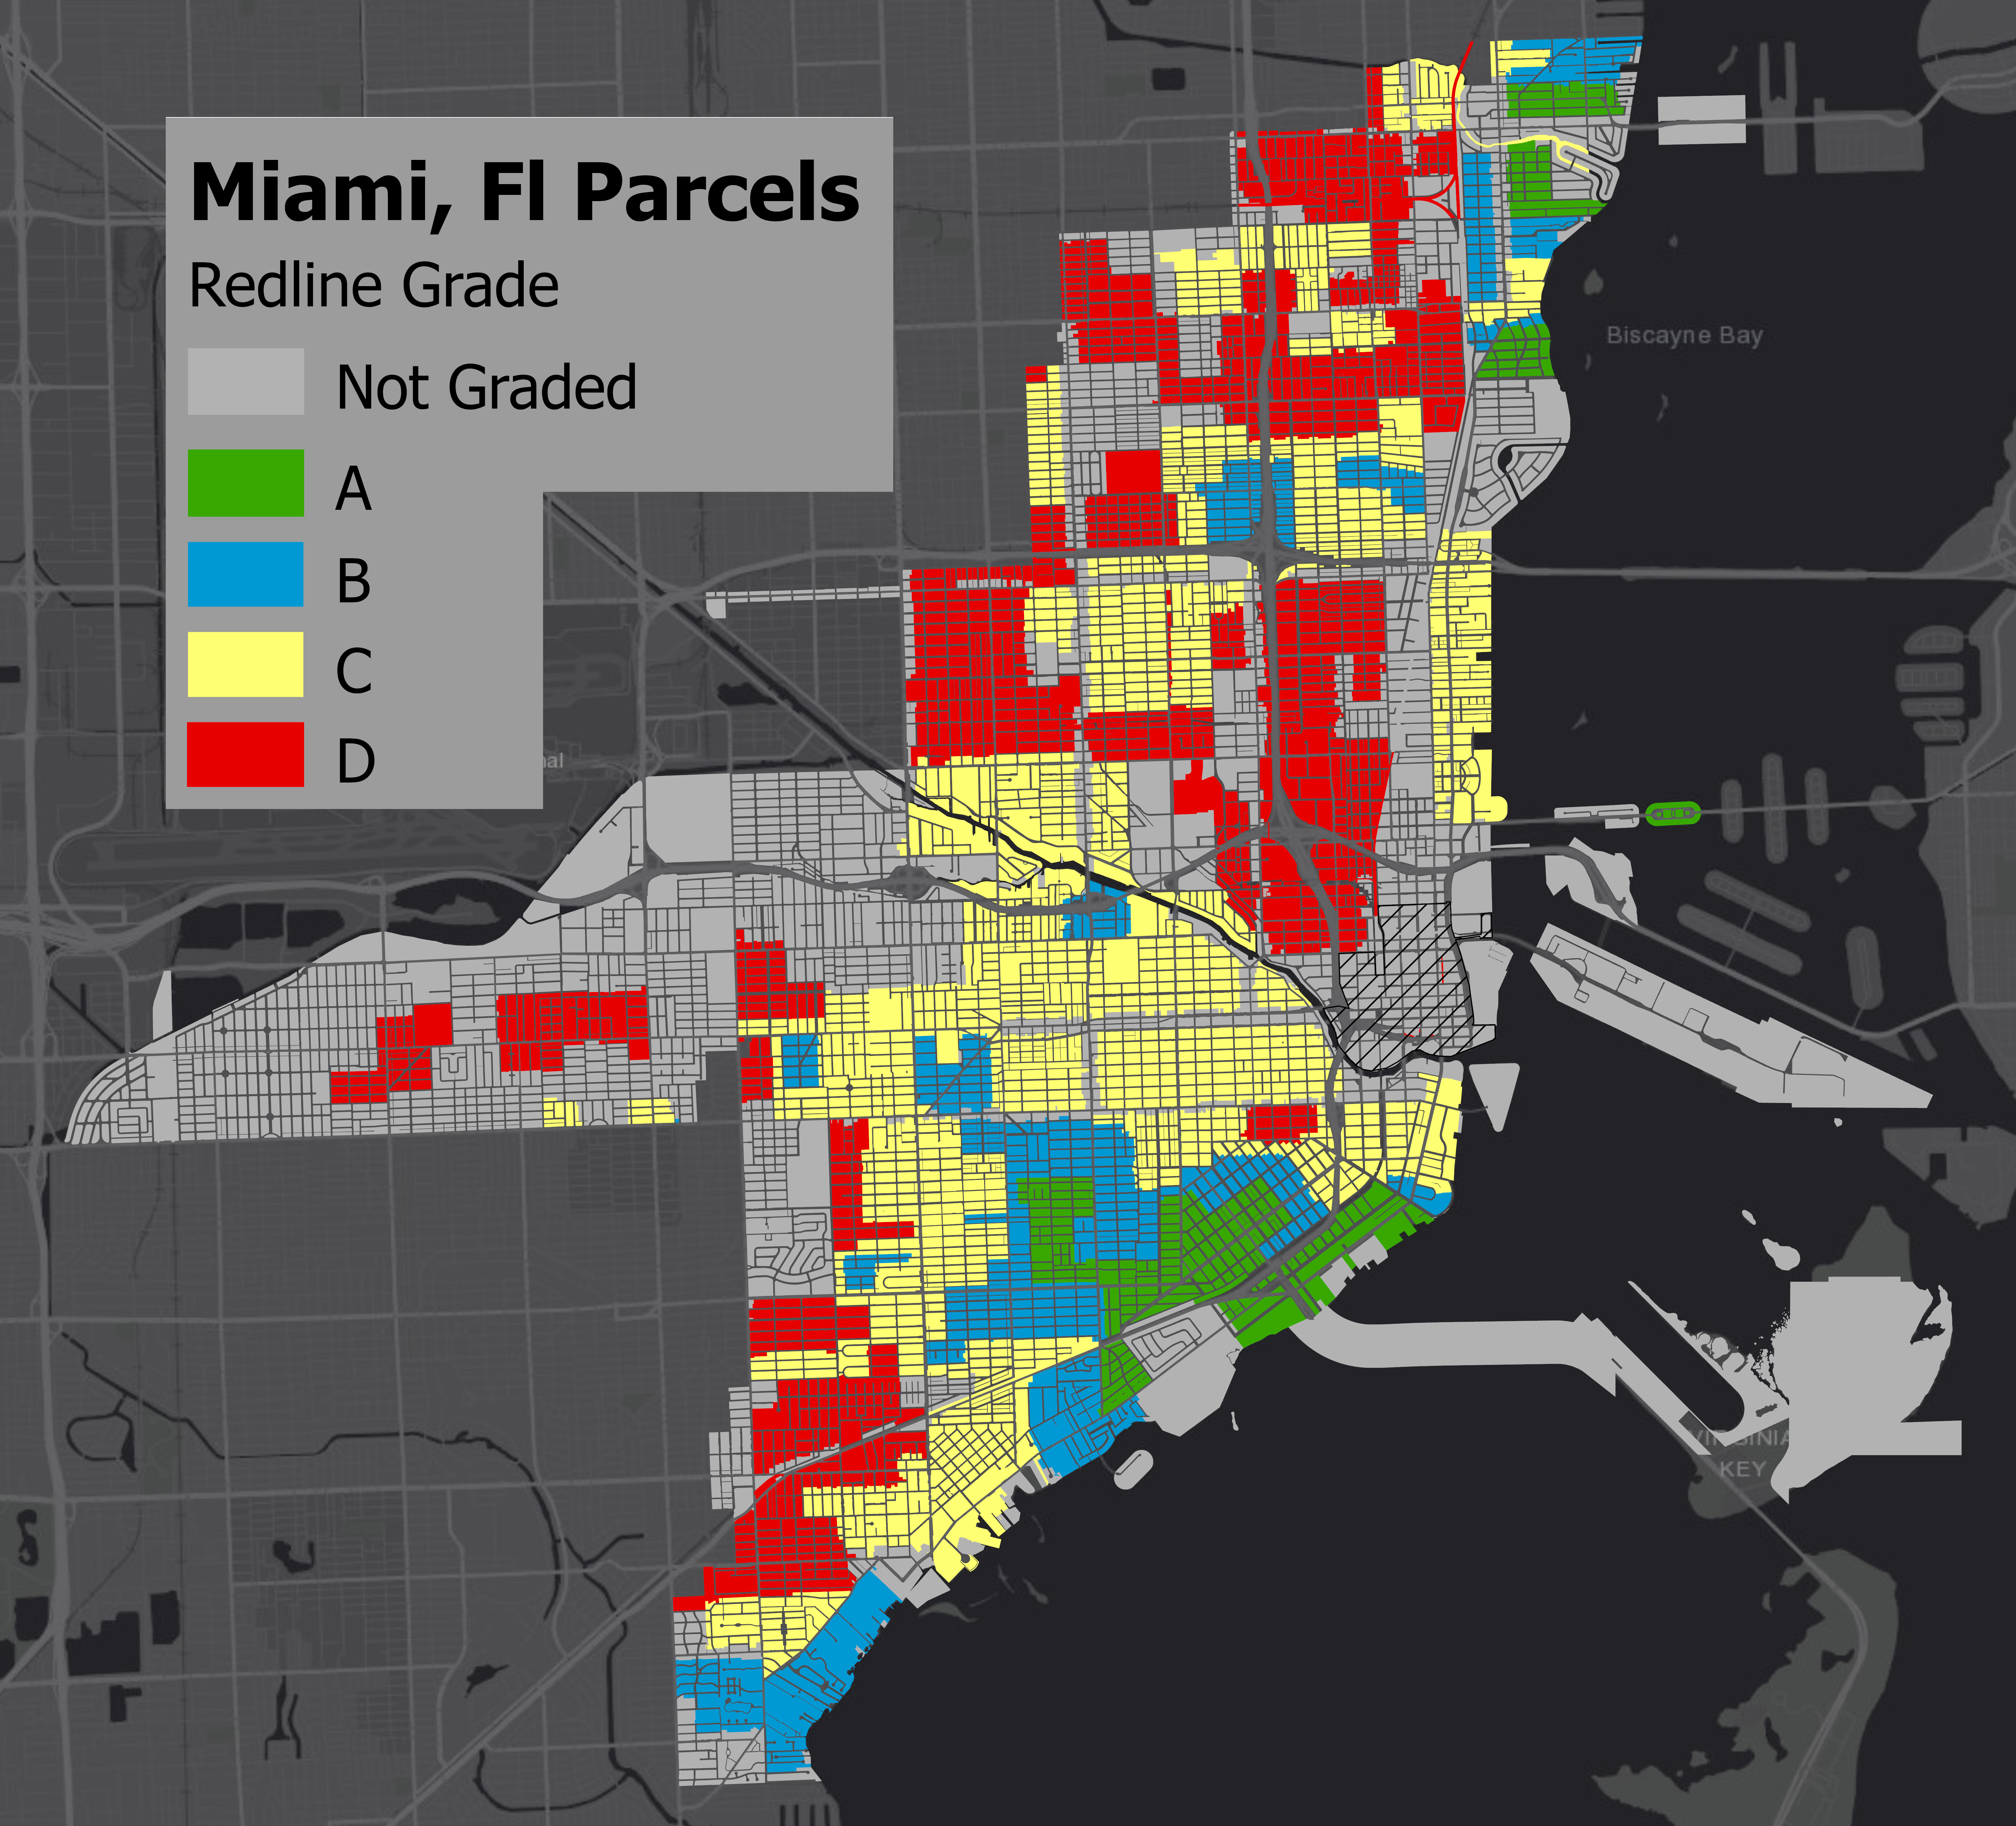
The study investigates the effects of the 1937 HOLC “redlining” of Miami, FL on the present-day value per acre (VPA) of parcels in Miami city limits.
The research was conducted to better understand the long-lasting impacts on generational wealth that redlining has imparted.
By overlaying historic redlining districts on current parcel geospatial data, I was able to generate a database of each parcel’s assessed VPA
and its associated historic HOLC grade. The data base was then put through a statistical analysis using R software. Results indicate that HOLC
redlining in the 1930s has a significant effect on toady’s parcels VPA. Successive grades are associated with a negative influence on VPA, with
redlined parcels having an average VPA $345,300 dollars lower than non-redlined properties. Miami, Fl should consider how redlining has
affected parcels values and consequently taxable values in their city. Through better understanding of areas that have experienced continued
disinvestment Miami may be able to focus more efficiently on economic development and hazard mitigation while avoiding disparate social impacts.
The project utilized ArcGIS Pro, RStudio statistical software, Excel, and Adobe Photoshop.
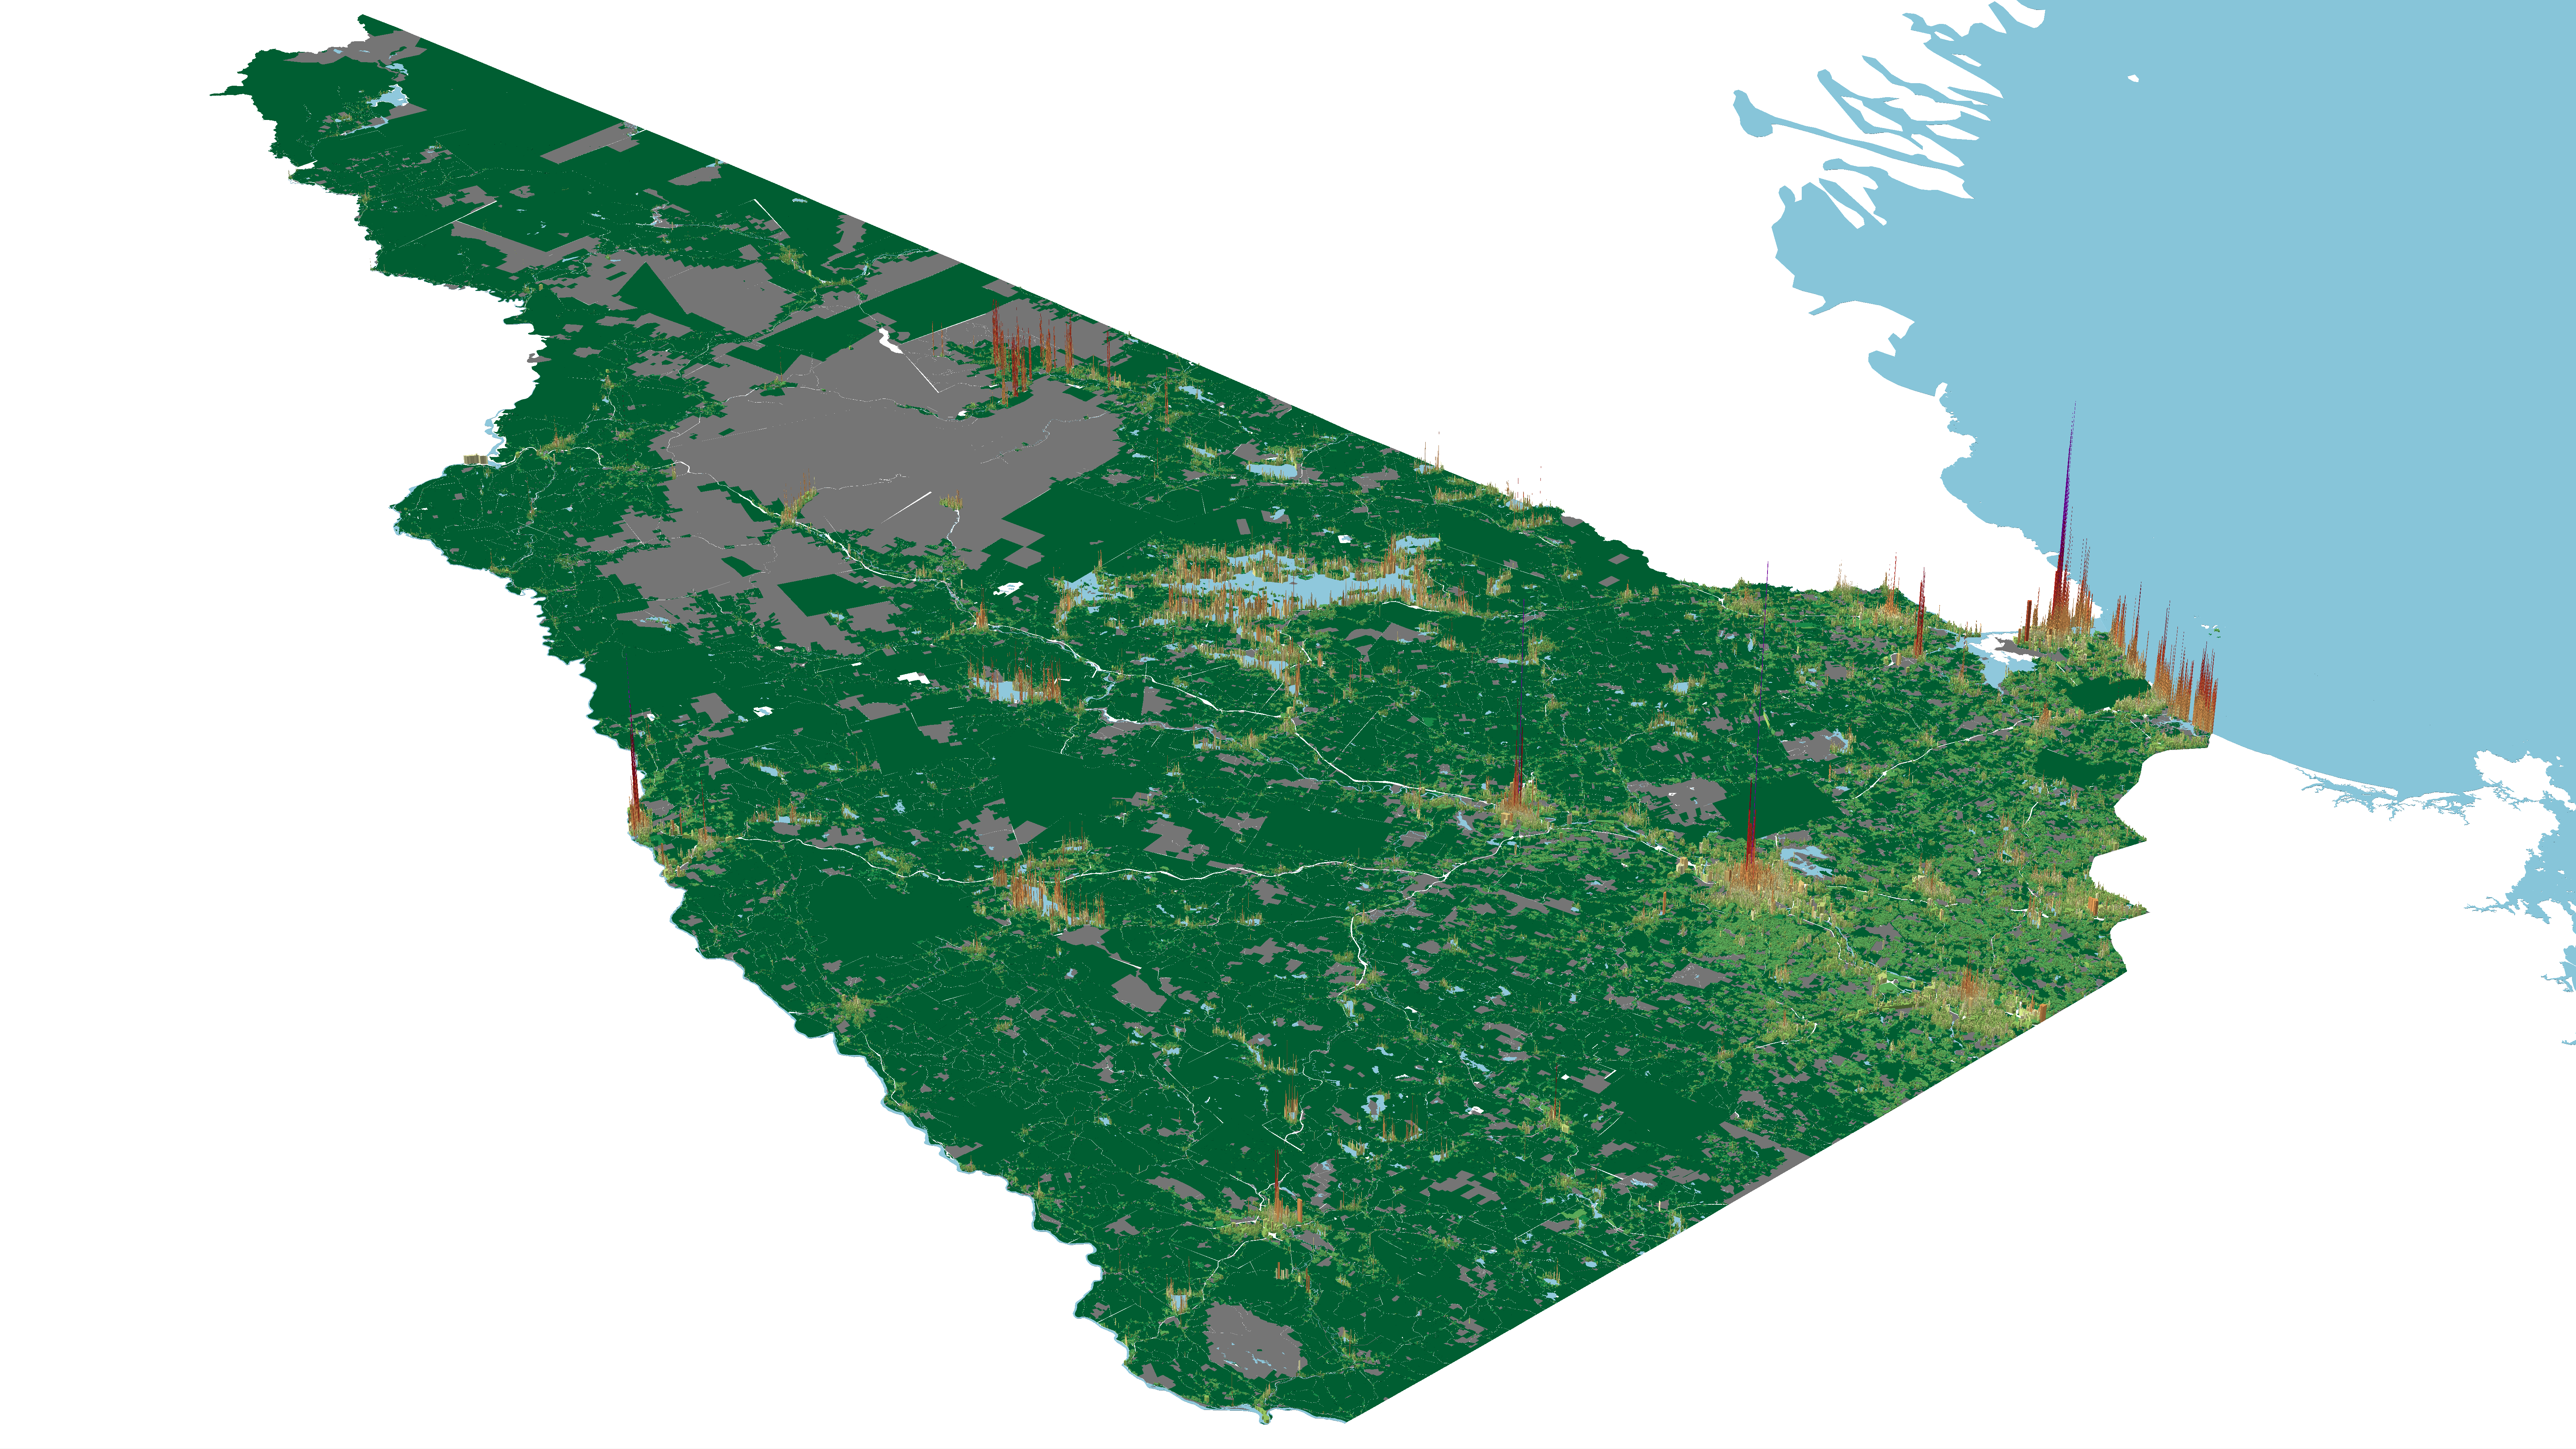
While I was working as a geospatial analyst with Urban3
I was assigned to the project of modeling economic productivity for the entire state of New Hampshire.
The main dataset that was analyzed was parcel data from counties across the state. Due to datasets coming from various municipalities
there was a large amount of data-cleaning required before any analysis could be done. Once the first initial data-cleaning and
combining of data-sets was finished the data-set totaled over 500,000 polygons. A second pass at cleaning and utilizing Urban3
methodology was then executed to craft a dataset which a thorough economic analysis could be performed .
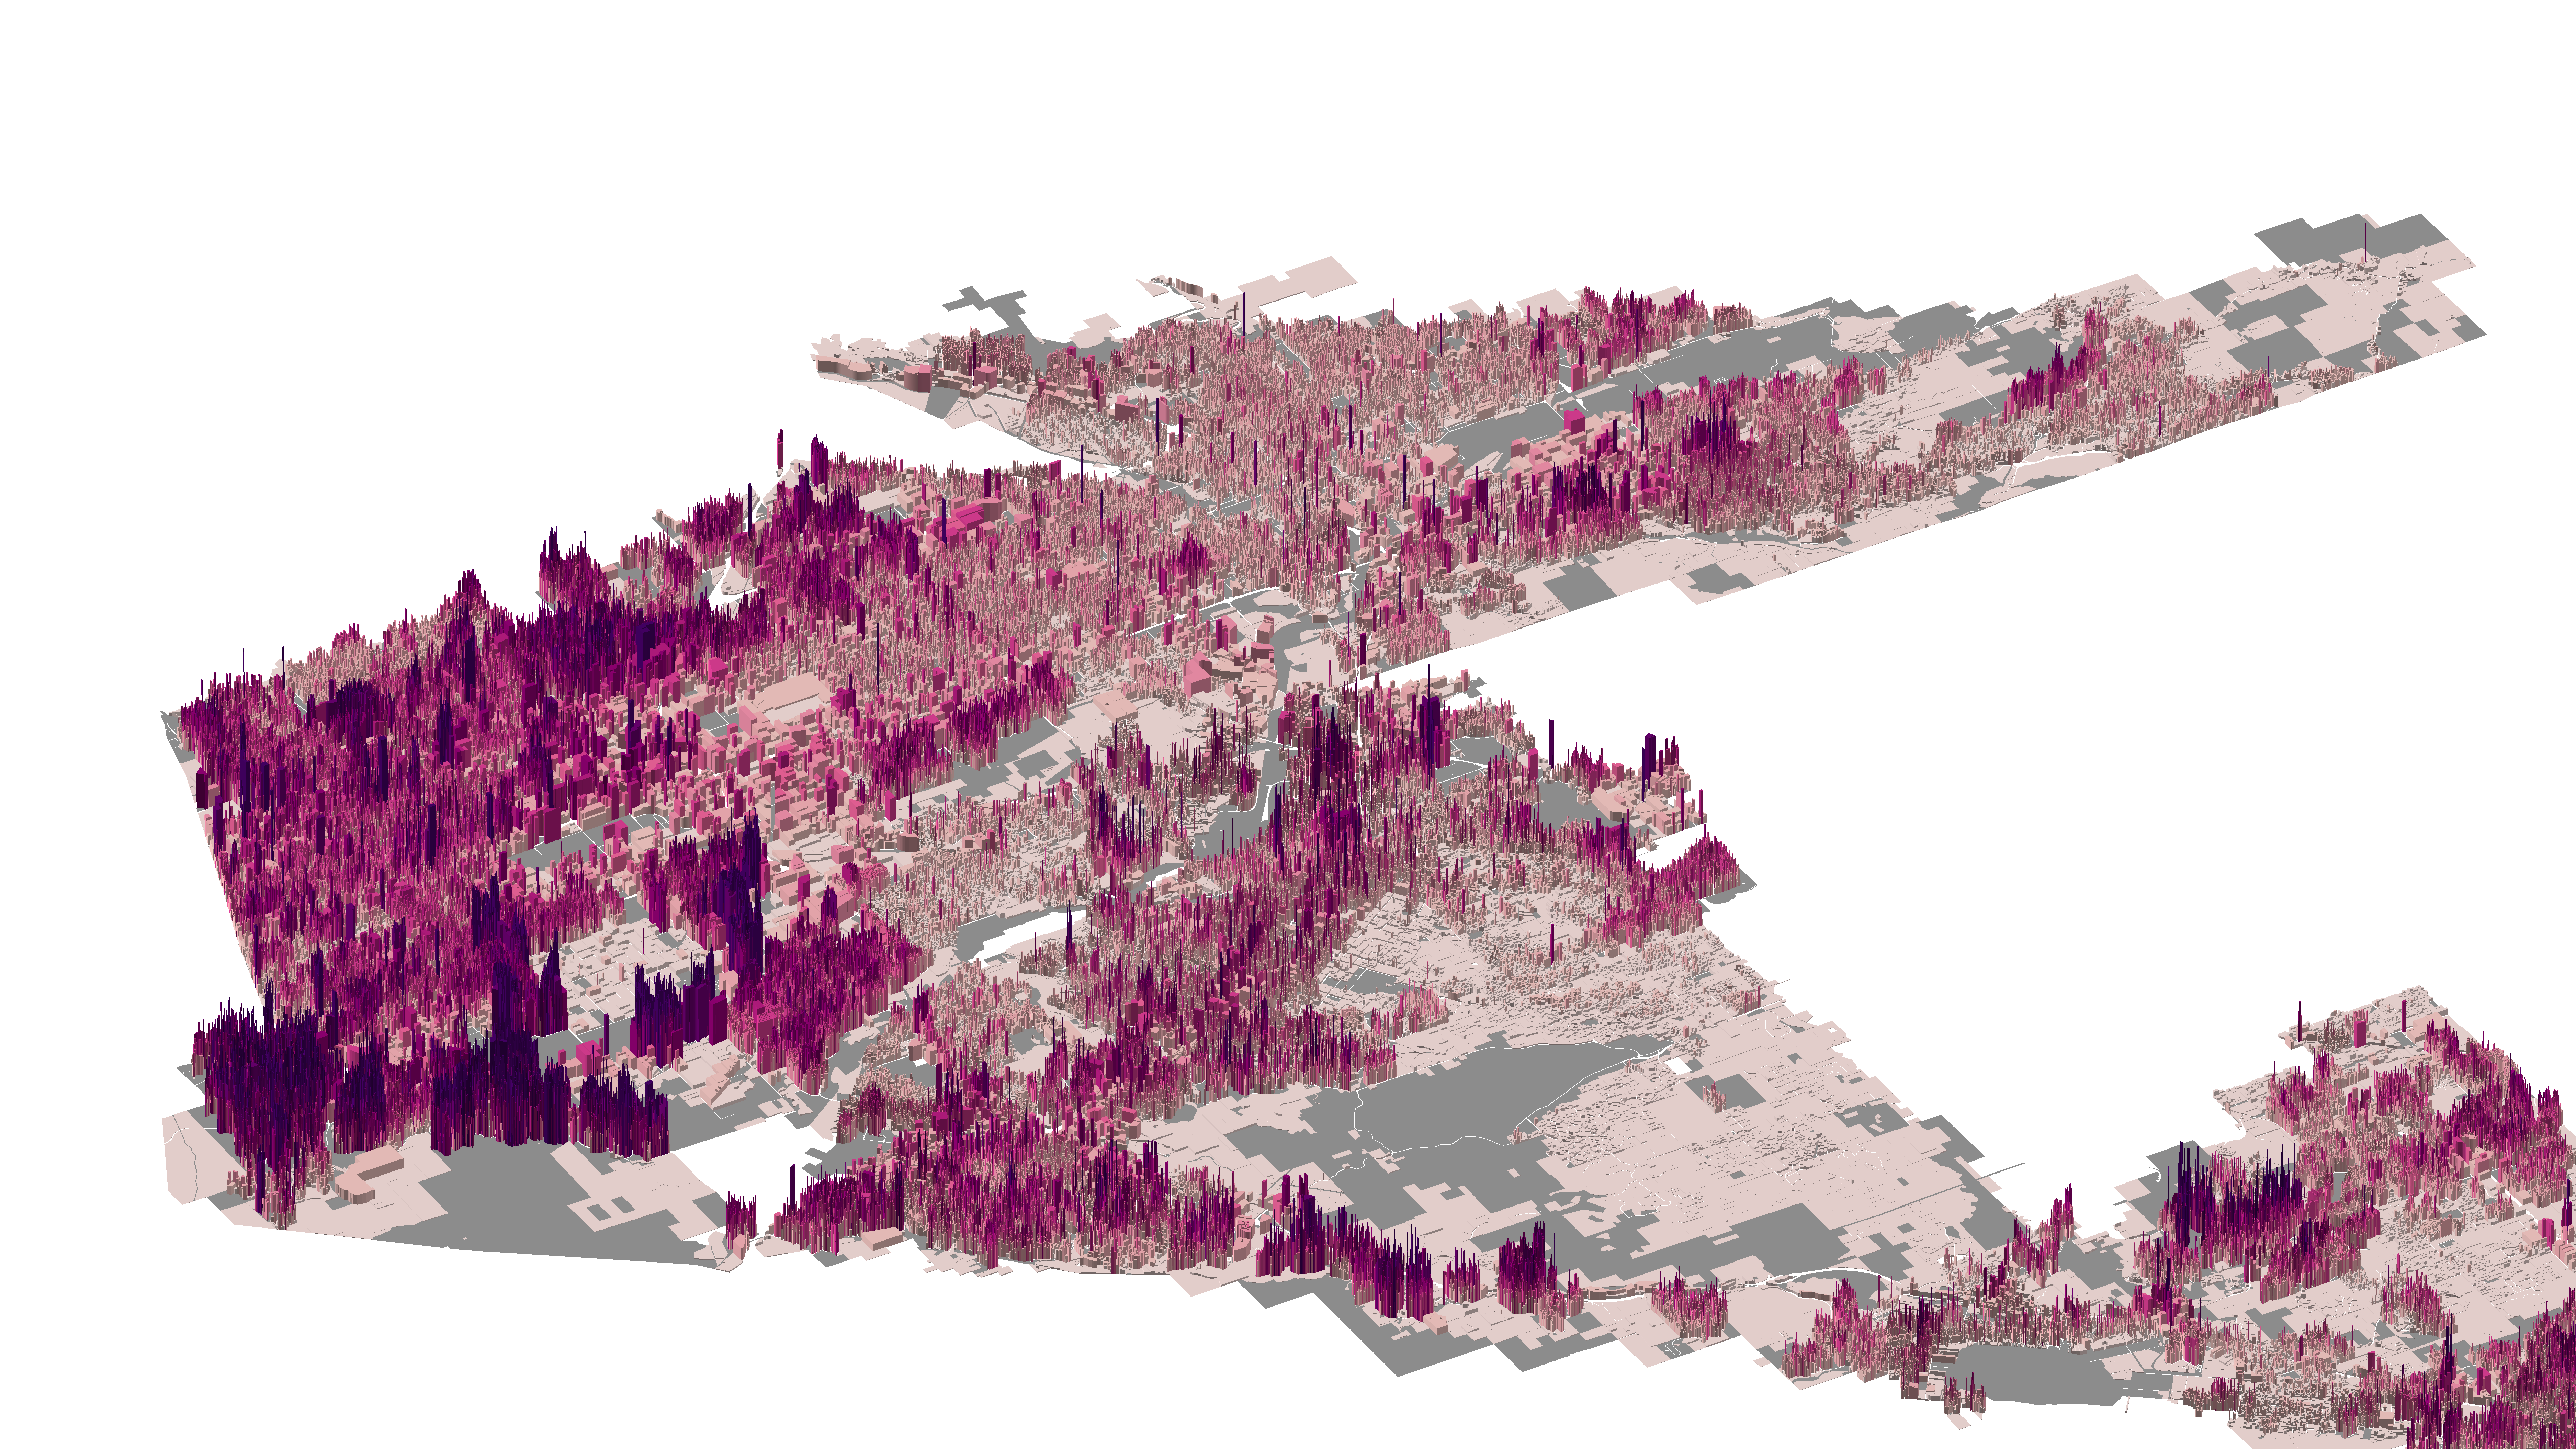
Analysis results were combined with an array of 2D and 3D graphics illustrating city and county tax productivity by development type.
The analysis then compared all 10 counties amongst themselves. Presentations were then created creating a narrative of each county's/cities
unique opportunities and challenges. These presentations were presented to state representatives along with the general public in Fall 2020.
The project utilized ArcMap, ArcScene, Adobe InDesign, and Adobe Photoshop.
Anim pariatur cliche reprehenderit, enim eiusmod high life accusamus terry richardson ad squid. 3 wolf moon officia aute, non cupidatat skateboard dolor brunch. Food truck quinoa nesciunt laborum eiusmod. Brunch 3 wolf moon tempor, sunt aliqua put a bird on it squid single-origin coffee nulla assumenda shoreditch et. Nihil anim keffiyeh helvetica, craft beer labore wes anderson cred nesciunt sapiente ea proident. Ad vegan excepteur butcher vice lomo. Leggings occaecat craft beer farm-to-table, raw denim aesthetic synth nesciunt you probably haven't heard of them accusamus labore sustainable VHS.
Anim pariatur cliche reprehenderit, enim eiusmod high life accusamus terry richardson ad squid. 3 wolf moon officia aute, non cupidatat skateboard dolor brunch. Food truck quinoa nesciunt laborum eiusmod. Brunch 3 wolf moon tempor, sunt aliqua put a bird on it squid single-origin coffee nulla assumenda shoreditch et. Nihil anim keffiyeh helvetica, craft beer labore wes anderson cred nesciunt sapiente ea proident. Ad vegan excepteur butcher vice lomo. Leggings occaecat craft beer farm-to-table, raw denim aesthetic synth nesciunt you probably haven't heard of them accusamus labore sustainable VHS.
Maps & Graphics
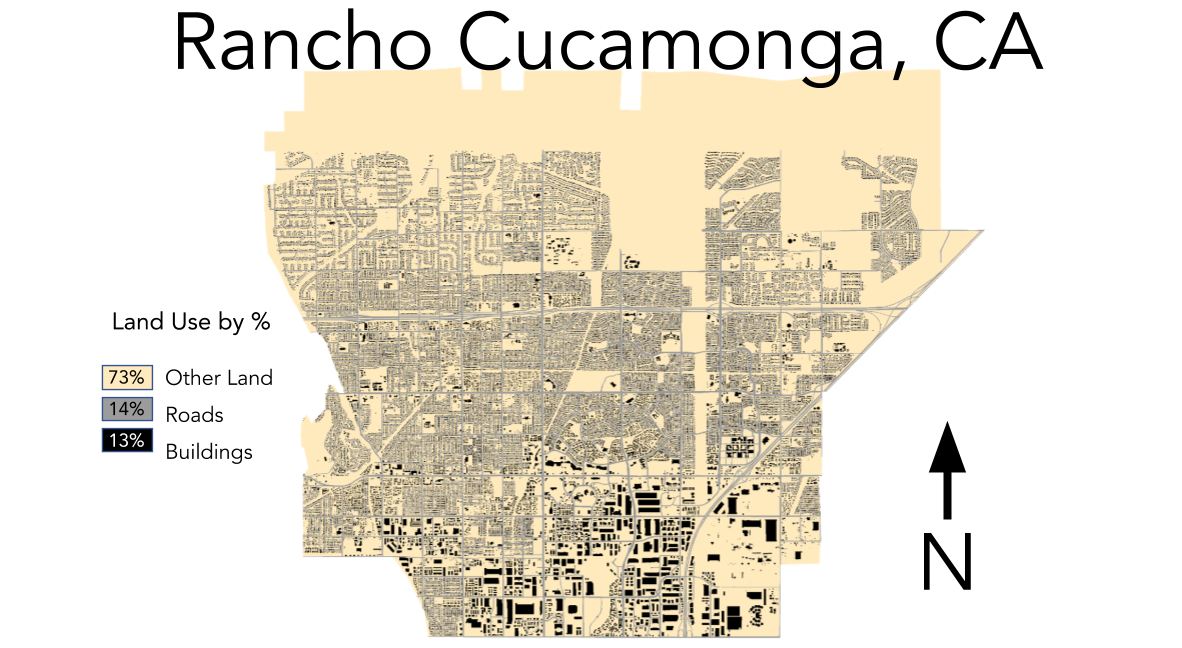
a collection of graphics I have produced
Articles
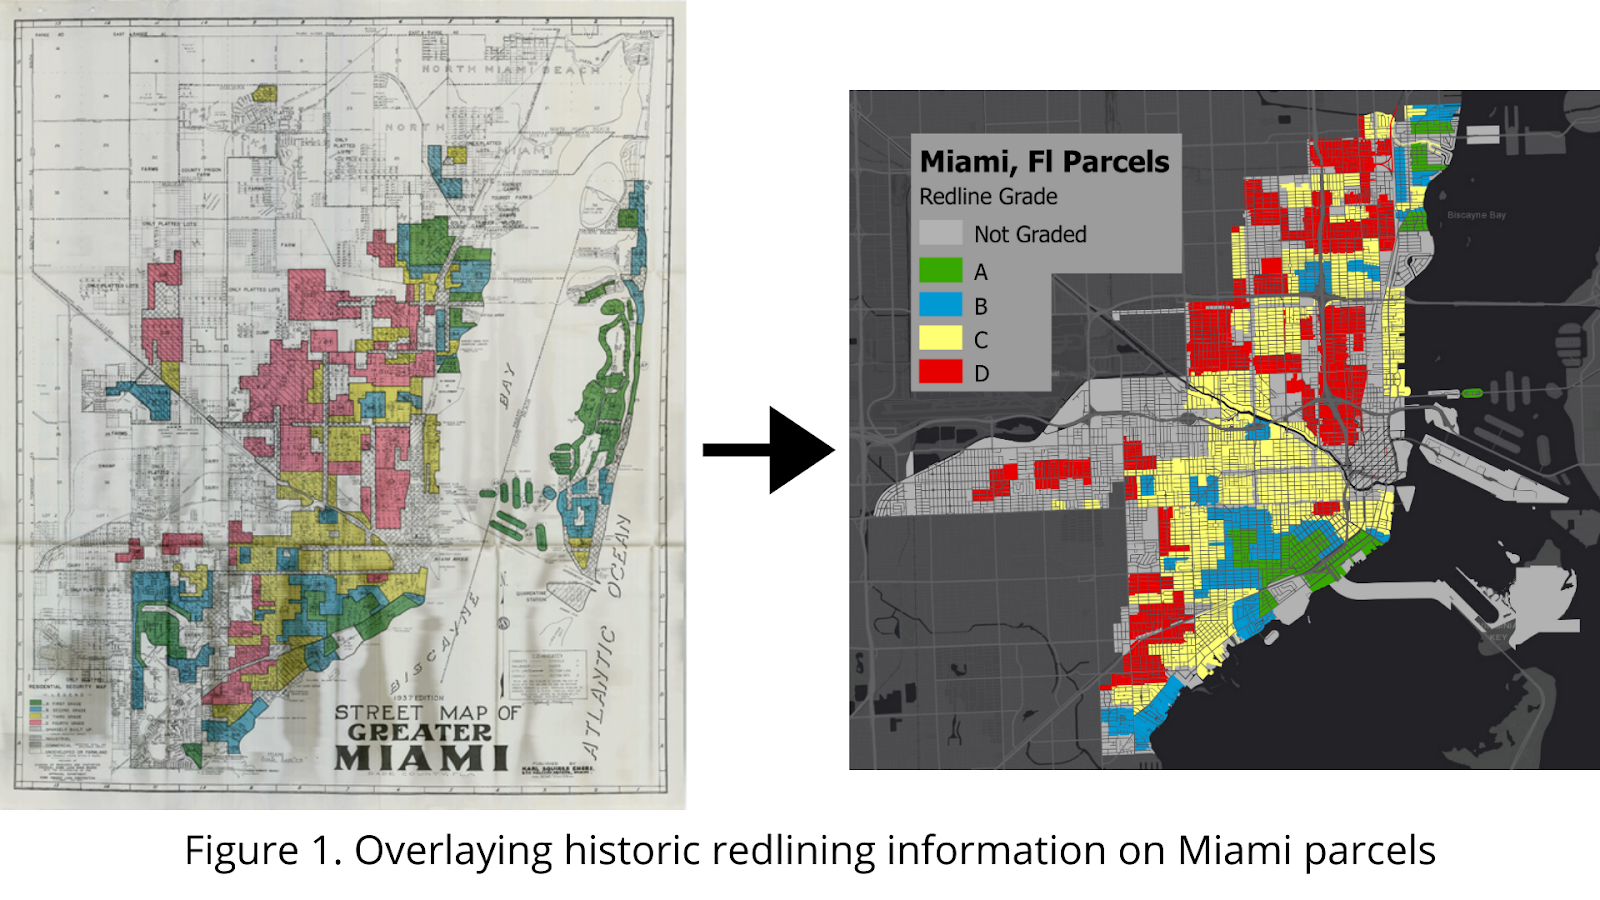
Miami Redlining
How Redlining in 1937 Miami, Fl continues to impact property values to this day.
Read Here
Planners as Pollinators
Read how the role of a planner can be likened to that of a pollinator in a larger ecosystem. Understanding this relationship can help planners to develop a more meaningful connection to the communities they engage with.
Read Here
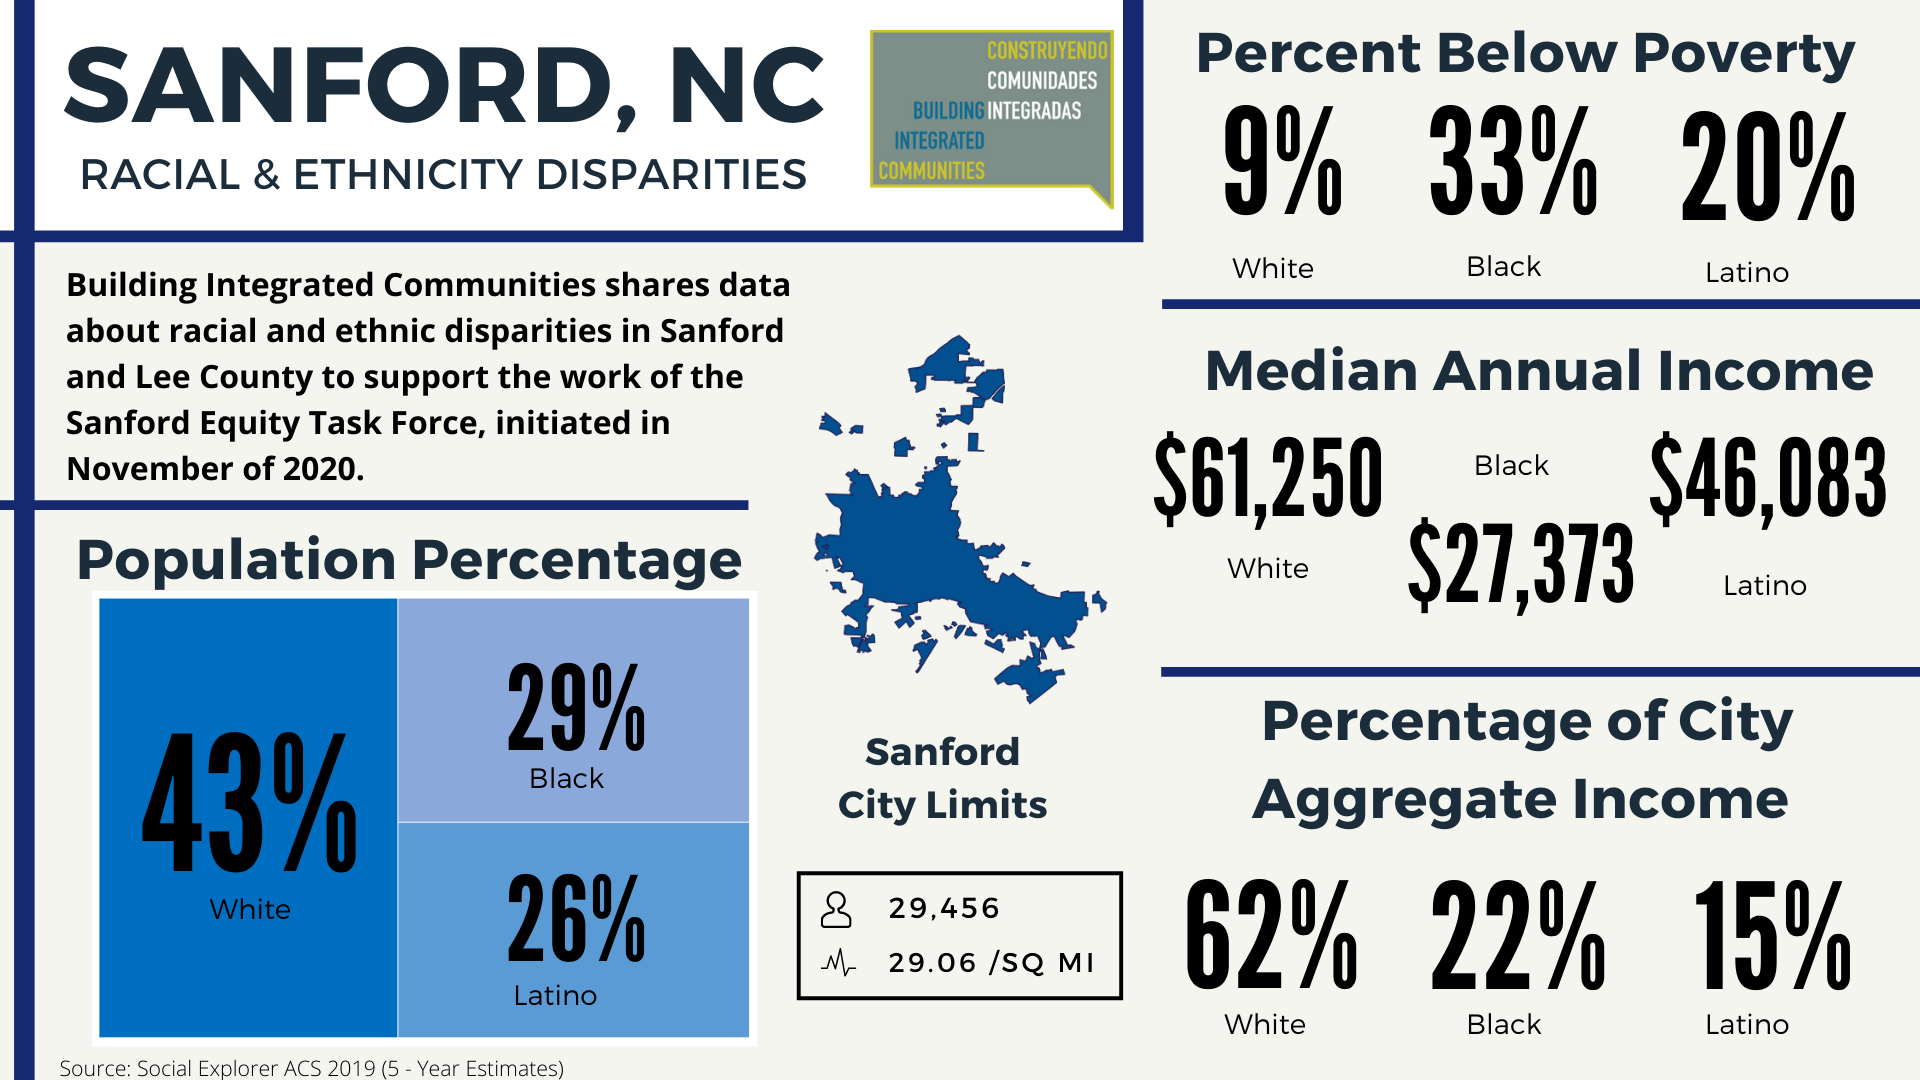
2020 Census & Building Integrated Communities
How does a organization focused on improving political understanding of immigrant populations use census data?
Read HereSkills
R Studio
Experience importing and manipulating large datasets to determine statistically significant relationships and export tables or graphics
ESRI Suite
Created compelling graphics and conducted geospatial analysis utilizing ESRI products including ArcPro, ArcMap, ArcGIS Online, and Business Analyst
Sketchup
Proficient in efficently crafting 3D models based off 2D schematics or from verbal explanation
Research
My rigorous educational background in tandem with working for dynamically growing private institutions has fostered my ability to investigate concepts and extrapolate conclusions
Leadership
Years of experience leading teams and delegating tasks in the wilderness, internationally, virtually and in the office
Presentation
My presentations are engaging and concisely explain data, they have been presented to state officials, academic conferences, and international clients
